A Deep Dive Into Inequality
What 11 Decades of Data Tell Us About Income and Wealth in America
A Deep Dive Into Inequality: What 11 Decades of Data Tell Us About Income and Wealth in America
When we talk about the “American Dream,” we often imagine a country where effort and ambition translate into opportunity and prosperity. But data tells a more complicated story—one where the rewards of economic growth have become increasingly concentrated, and where generational wealth and racial disparities continue to shape people’s lives far more than merit or determination.
That’s why it’s worth diving into “A Guide to Statistics on Historical Trends in Income Inequality,” an in-depth report recently updated by the Center on Budget and Policy Priorities (CBPP). This research traces inequality across more than a century of U.S. economic life, shedding light on how household incomes, wealth, and poverty have evolved—and what that evolution means for the future of shared prosperity.
From Shared Prosperity to a Sharper Divide
Between the late 1940s and early 1970s, American families experienced a rare kind of economic alignment—incomes grew rapidly across all segments, from working-class households to those at the top. But starting in the mid-1970s, this broad-based growth fractured.
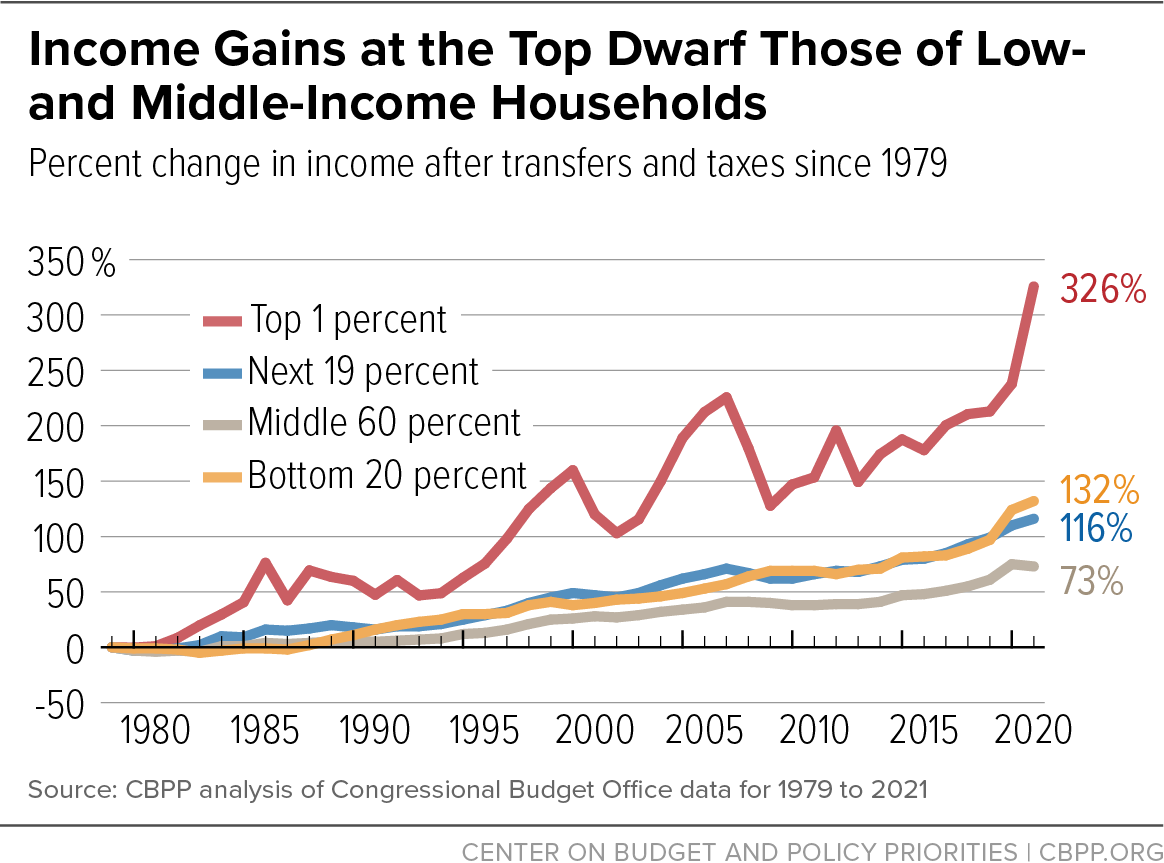
From 1979 to 2007:
Top 1% incomes quadrupled after taxes and transfers.
Middle-income families saw modest gains, barely keeping pace with inflation.
Lower-income households, despite receiving more support, remained significantly behind.
Figure 3: Changes in Average After-Tax Income by Income Group, 1979–2021
Why this matters:
This divergence marks the end of an era of shared prosperity and the beginning of an economy shaped by concentration rather than inclusion. When middle- and low-income families don’t see meaningful income growth, their ability to build wealth, support education, or invest in their futures is stunted. That’s not just a family problem—it’s a national one.
Wealth Inequality: The Roots of Economic Insecurity
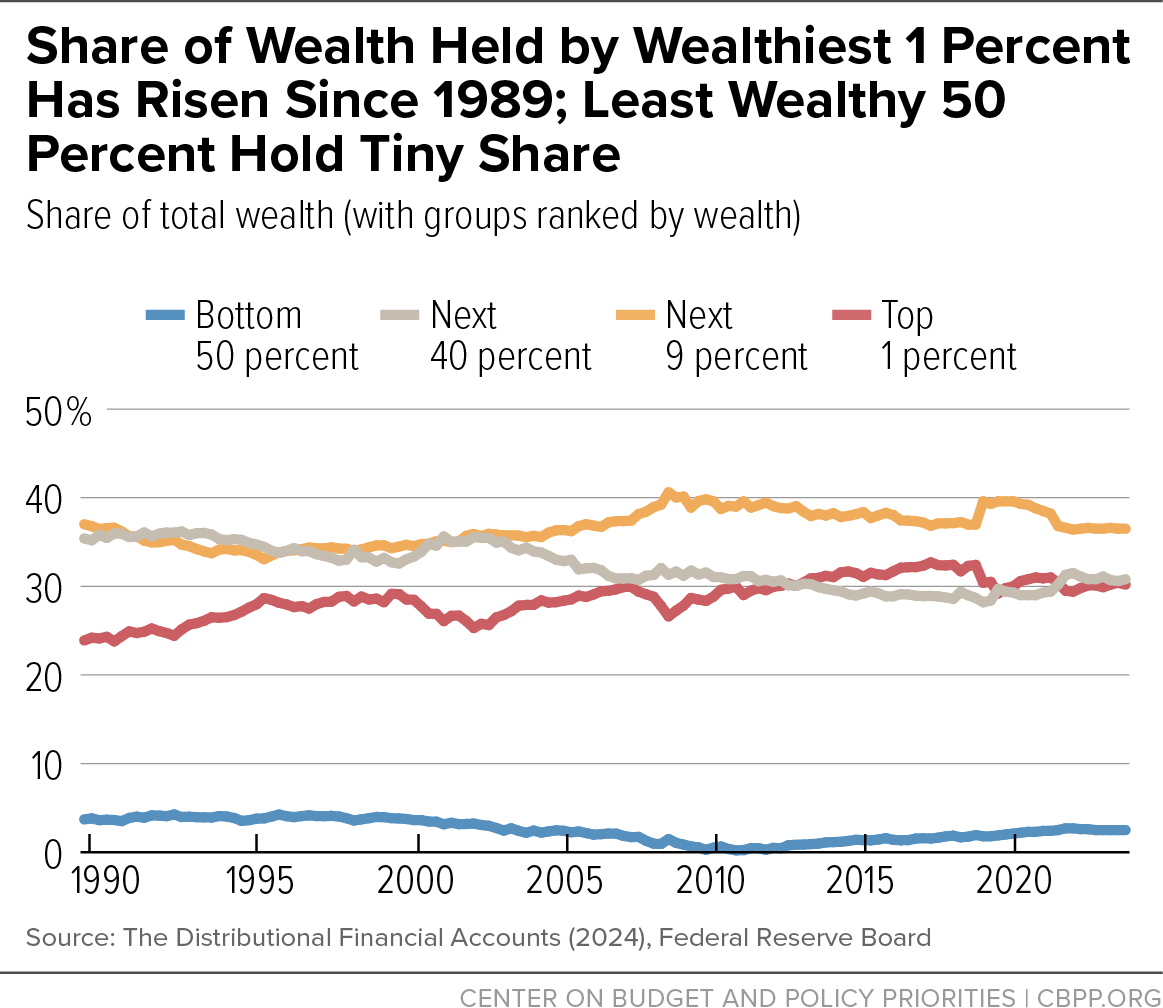
While income inequality has widened, wealth inequality has become even more extreme.
The top 10% of households hold more than two-thirds of all U.S. wealth.
The bottom 50% hold less than 4%.
Wealth inequality has grown steadily since the 1980s.
Figure 7: Wealth Held by Percentile of the Distribution, 1989–2023 (DFA data)
Why this matters:
Wealth is what allows families to weather storms, invest in opportunity, and pass down security. When the vast majority of it is held by the top 10%, the rest of the country remains economically fragile and dependent on credit, rather than building assets.
Understanding the Data: Different Lenses, Same Story
CBPP walks readers through how different data sources tell different stories:
Census data highlights middle- and low-income trends but misses high earners.
IRS data captures high incomes, but not non-filers (who tend to be low-income).
CBO data blends multiple sources and includes effects of taxes and transfers.
Why this matters:
Better data equals better policy. Policymakers, journalists, and advocates rely on these statistics to understand who’s thriving—and who’s being left behind.
Racial and Ethnic Gaps: Generations of Disparity
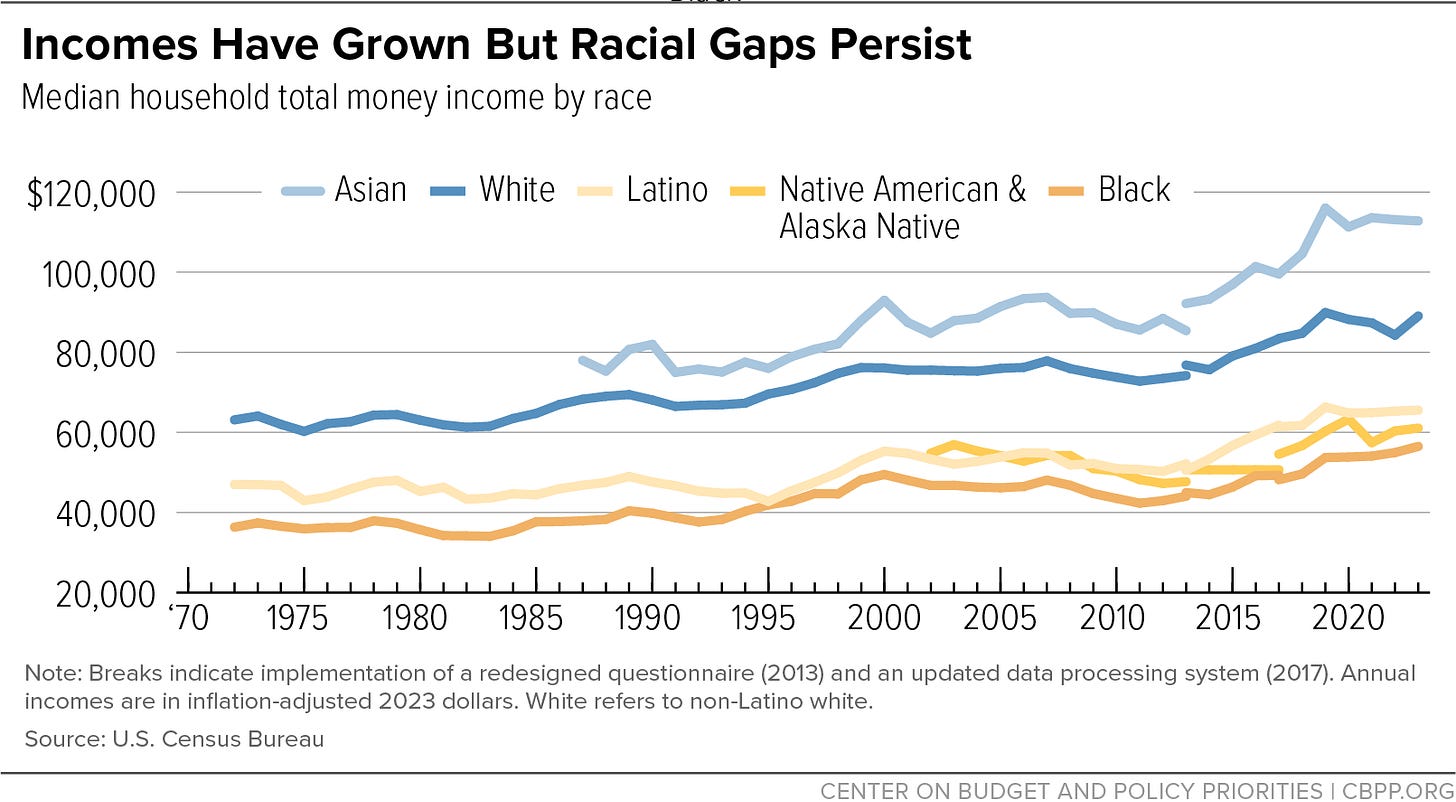
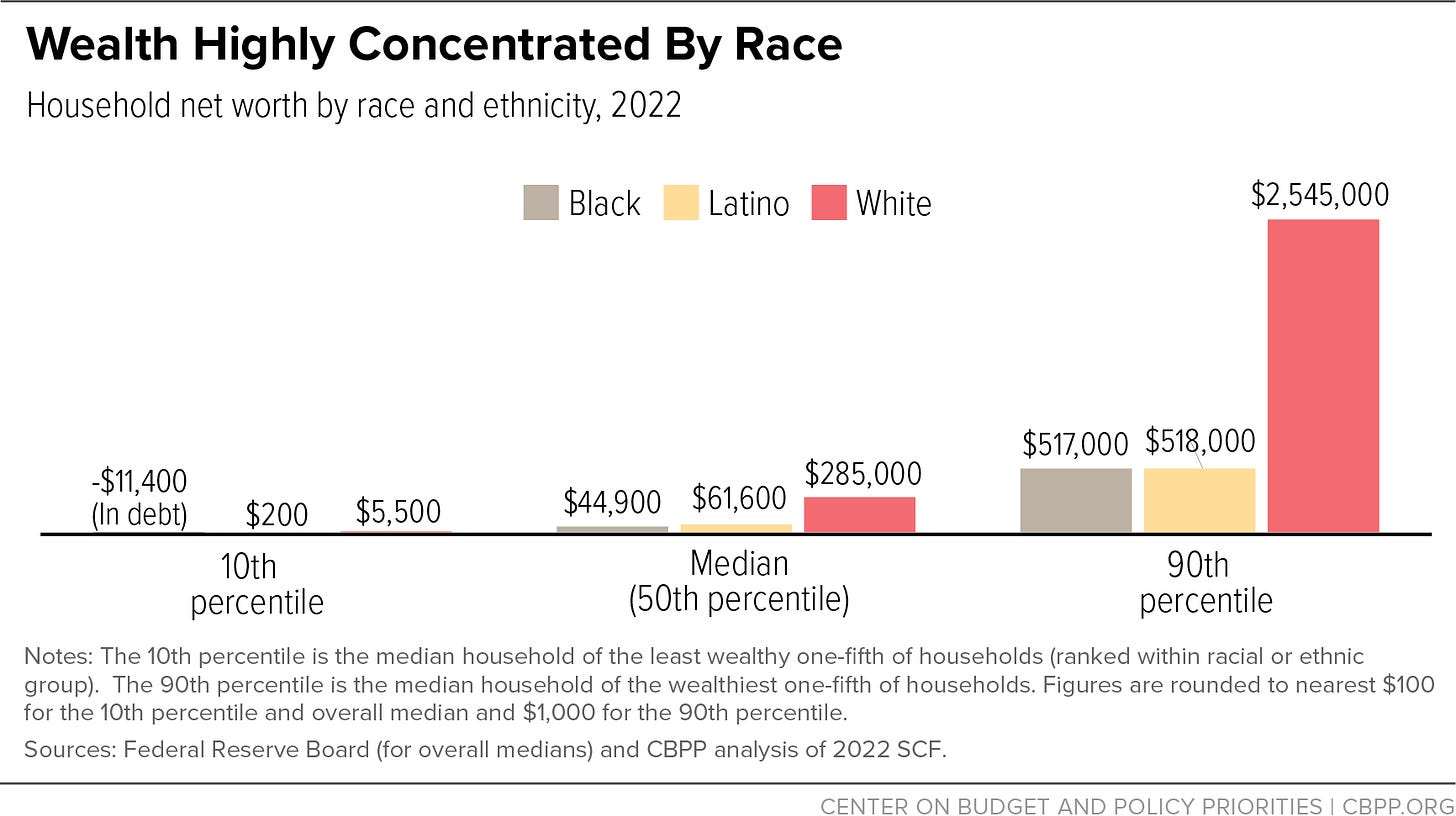
In 2023:
Black median household income was 63% of white households.
Latino income was 74% of white households.
Median net worth among Black households was just 16% of that of white households.
Figure 2: Median Household Income by Race and Ethnicity, 1972–2023
Figure 6: Median Net Worth by Race and Ethnicity, 2022
Why this matters:
These aren’t just statistics—they’re reflections of deep, systemic inequities that remain unresolved. True economic justice will require direct, intentional efforts to close these gaps, especially in wealth.
Do Government Programs Reduce Inequality?
Yes—and during COVID-19, the effects were historic. In 2020 and 2021:
The Child Tax Credit and unemployment expansions lifted millions out of poverty.
Income inequality dropped more than any time since 1979.
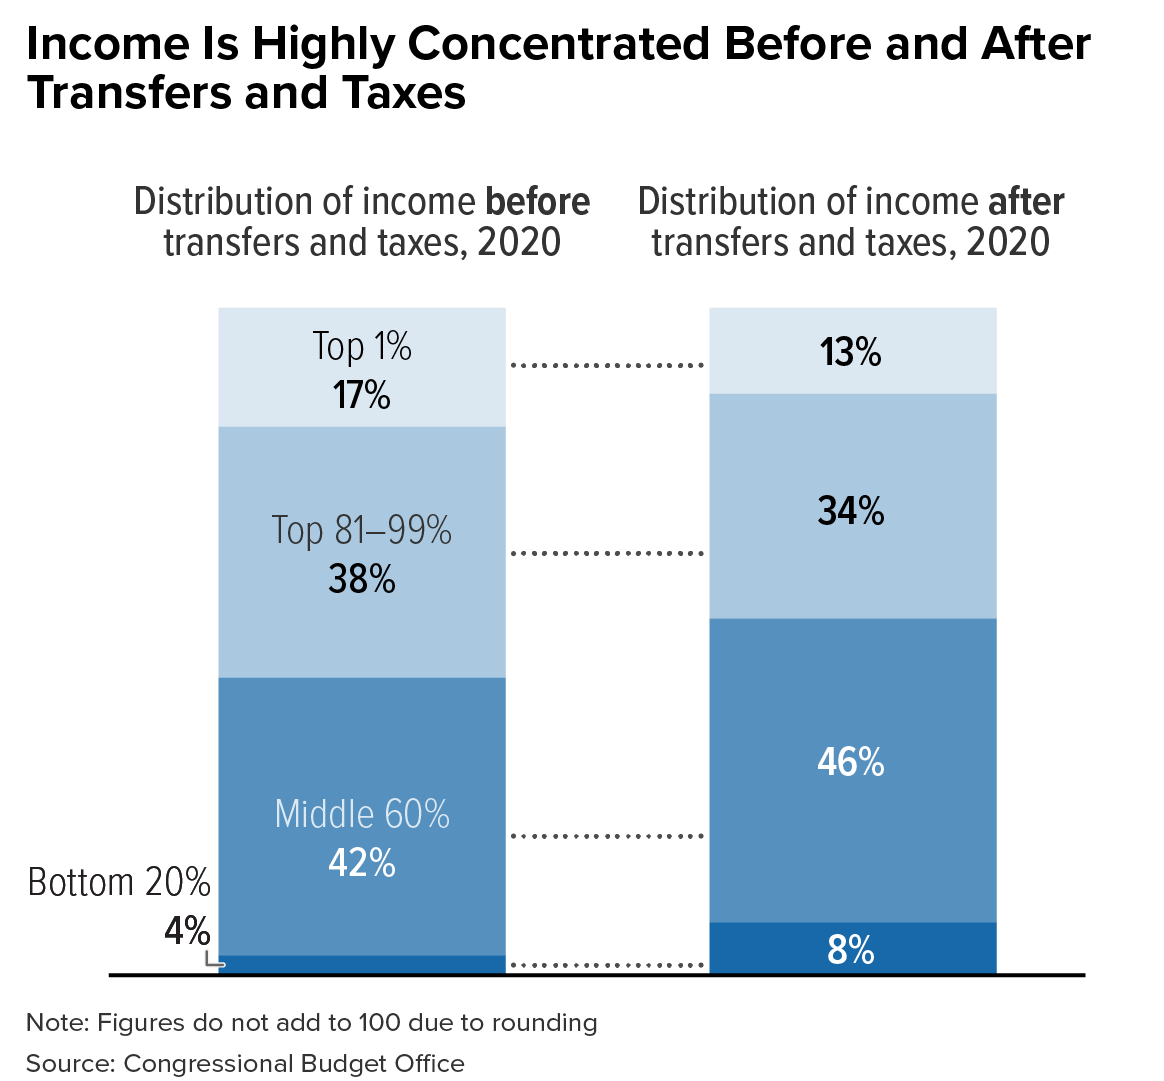
Figure: Transfers and Taxes Are Progressive
Why this matters:
Government interventions work—especially when they are bold and timely. They demonstrate how smart policies can rapidly improve economic equity.
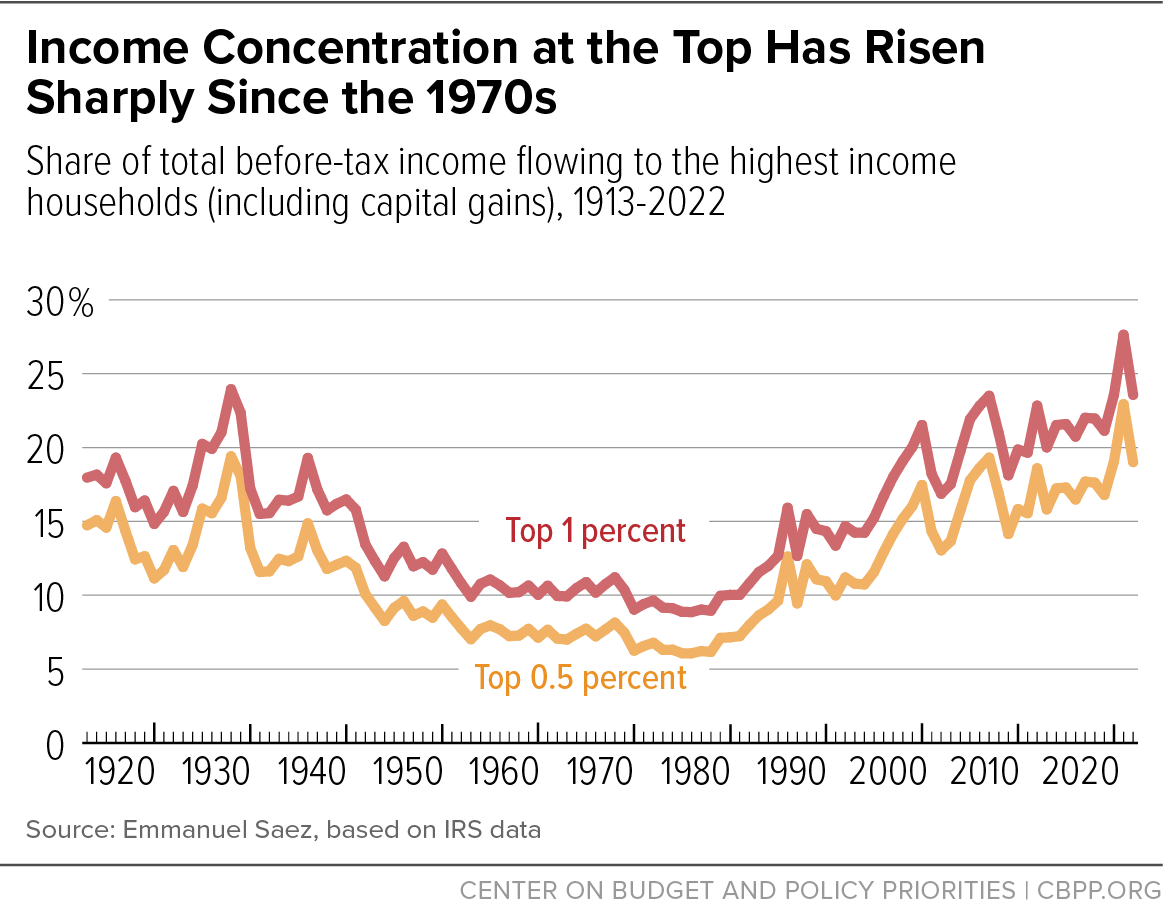
A Century of Trends: Back to 1920s Levels
Piketty and Saez’s long-term view shows:
Income concentration peaked in the 1920s.
It fell sharply mid-century.
And it’s now back near 1928 levels.
Figure 4: Share of Income Going to the Top 1 Percent, 1913–2022
Why this matters:
History teaches us what happens when economic power concentrates at the top—instability, crisis, and backlash. These trends are not inevitable; they are policy-driven.
The Poverty Picture: Seeing the Full Landscape
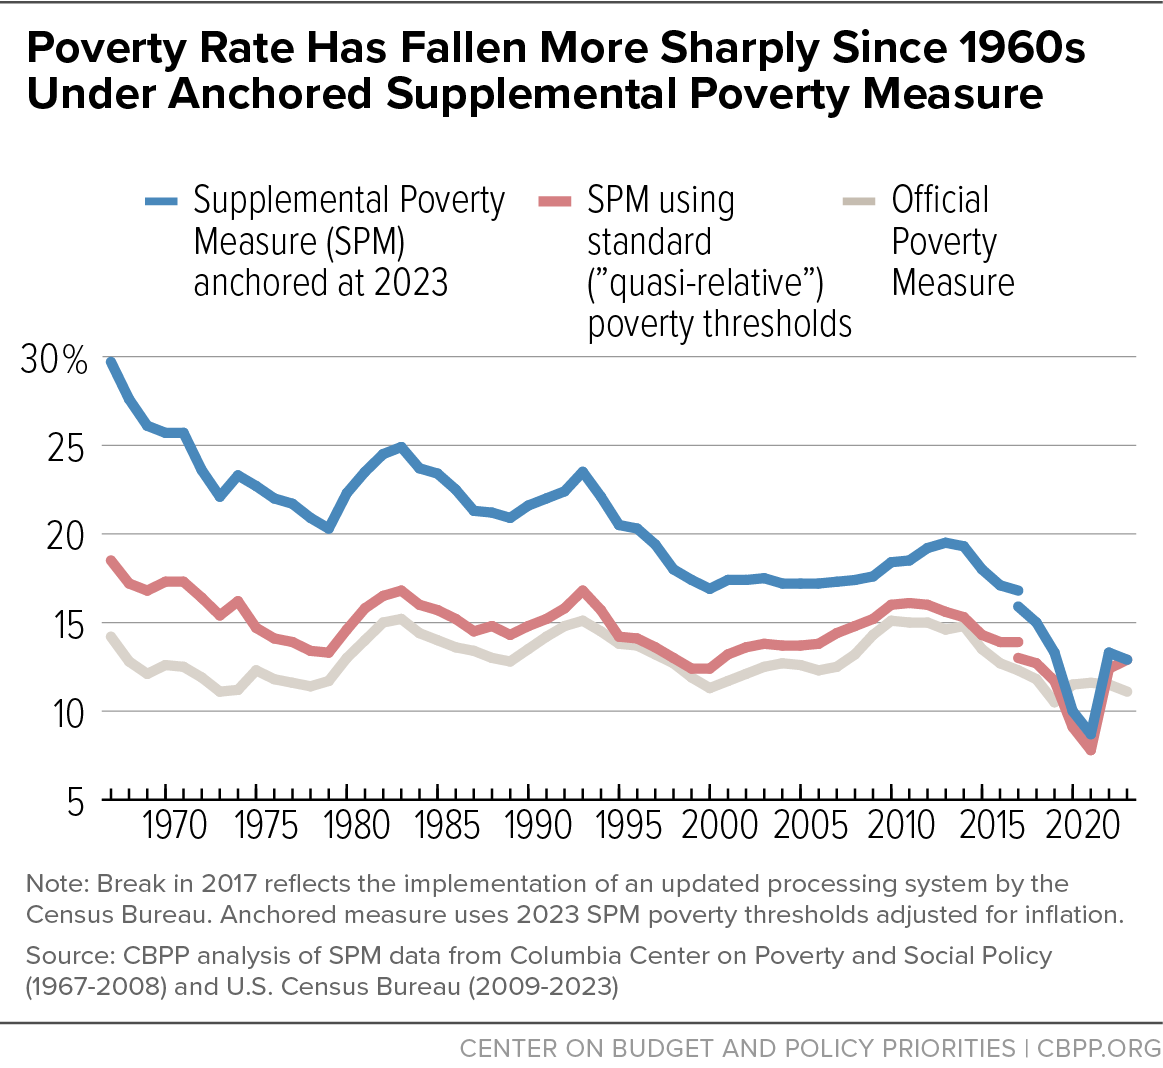
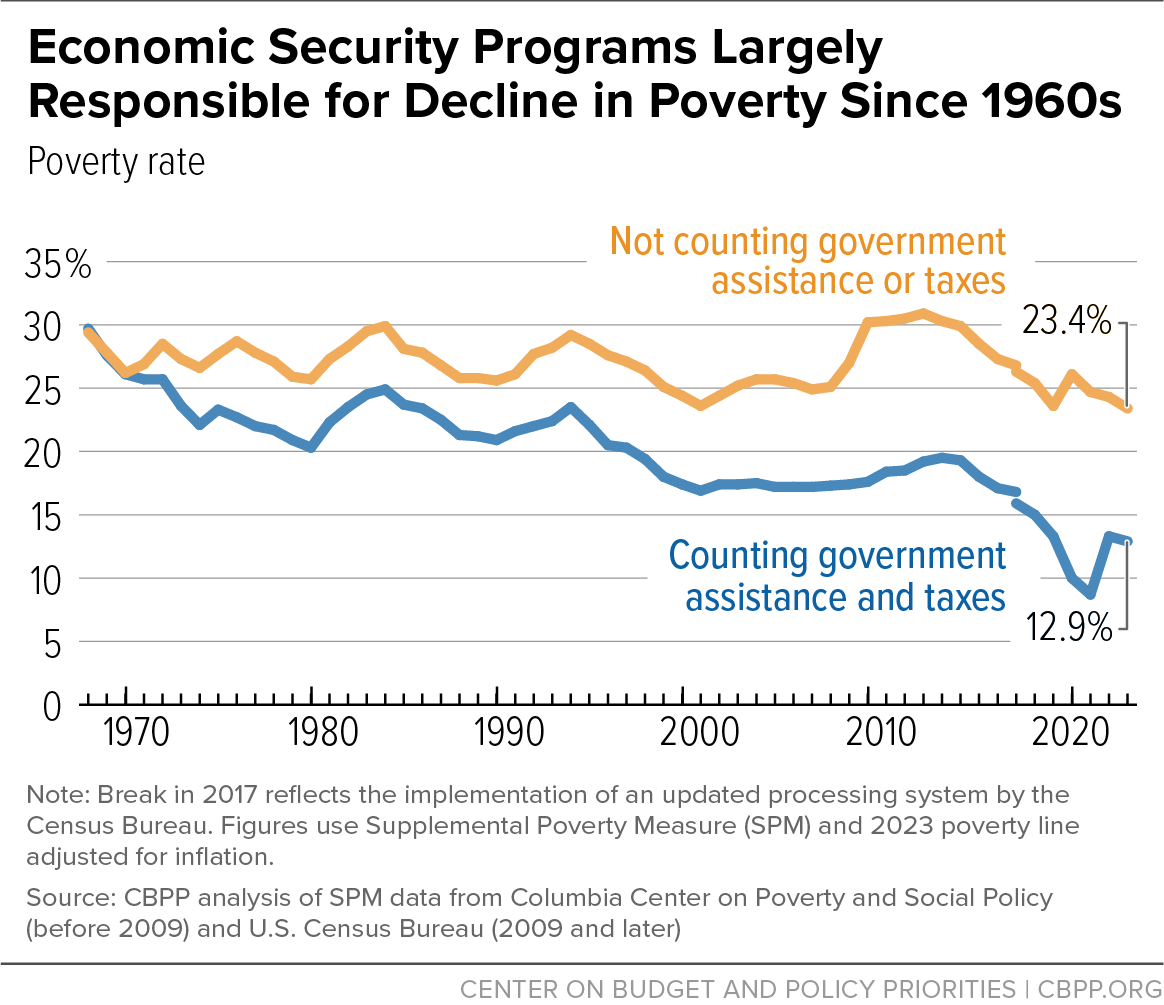
Using the Supplemental Poverty Measure (SPM):
Poverty dropped from 29.7% in 1967 to 12.9% in 2023.
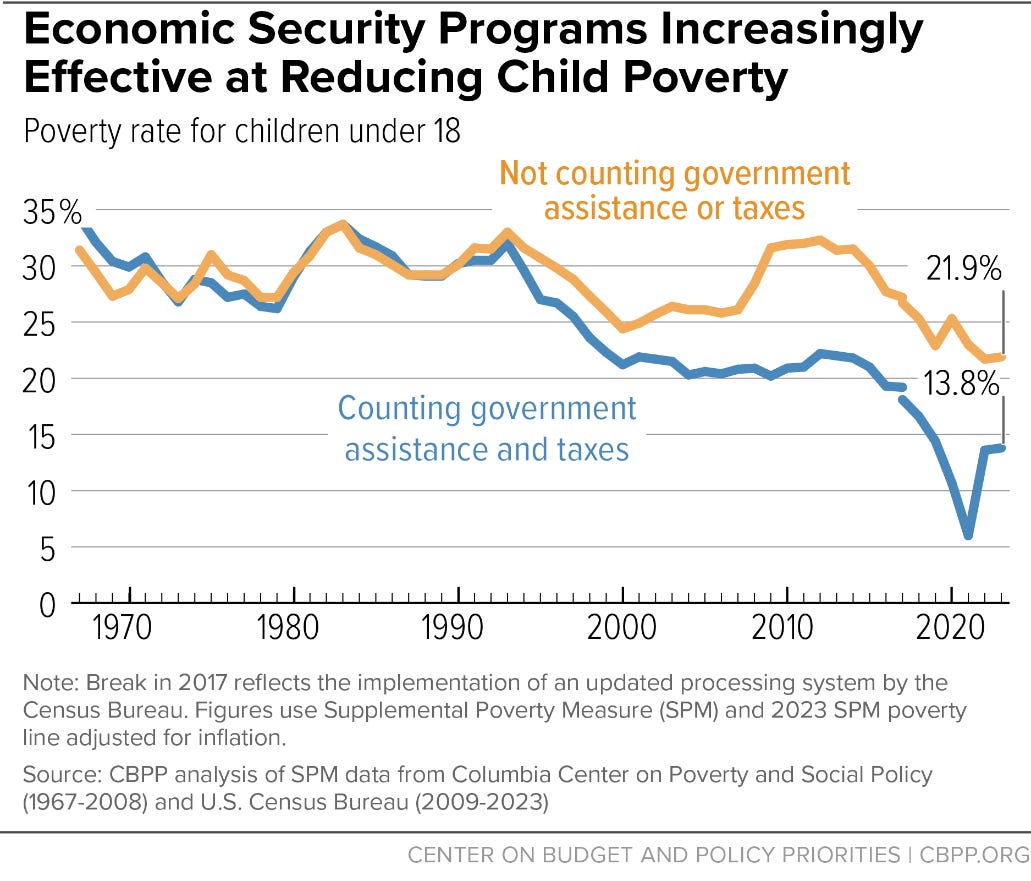
Child poverty reached a record low of 6% in 2021, before spiking again in 2022.
Figure 9: SPM Poverty Rates (Relative and Anchored), 1967–2023
Figure 10: SPM Poverty Rates With and Without Government Support, 1967–2023
Figure 11: Child Poverty Before and After Government Support, 1967–2023
Why this matters:
These figures show that poverty isn’t just a matter of markets—it’s shaped by political will and policy choices. We have the tools to reduce poverty dramatically, but it requires sustained commitment.
Final Thoughts: Why This All Matters
This report offers a sobering but hopeful message: inequality is real, growing, and consequential—but we are not powerless. With informed policy and public support, we can reverse course. Doing so won’t just help those struggling today—it will reinvigorate our economy, strengthen our democracy, and move us closer to a truly inclusive prosperity.
Read the full CBPP report here:
A Guide to Statistics on Historical Trends in Income Inequality
About the Author
Charles Sims is an affordable housing developer and community builder with over 17 years of experience leading real estate projects that prioritize people, equity, and long-term impact. He has helped shape award-winning multifamily communities across the Mid-Atlantic and South Florida. Charles is passionate about creating housing that not only provides shelter but supports dignity, stability, and connection.


Equity doesn’t happen on its own, it’s built intentionally! Great article. You did a wonderful job explaining the history and the why behind inequality. 👏🏾